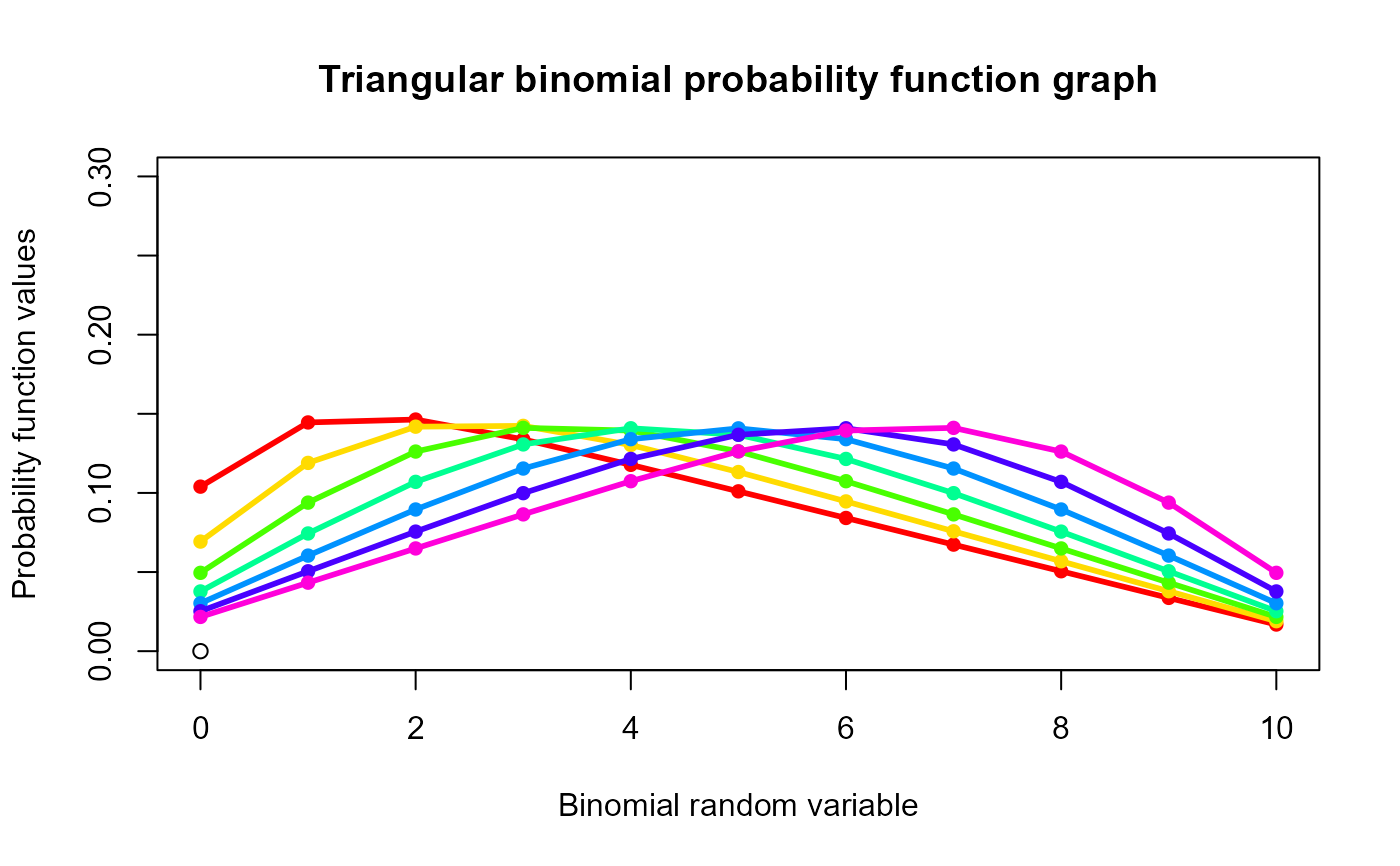
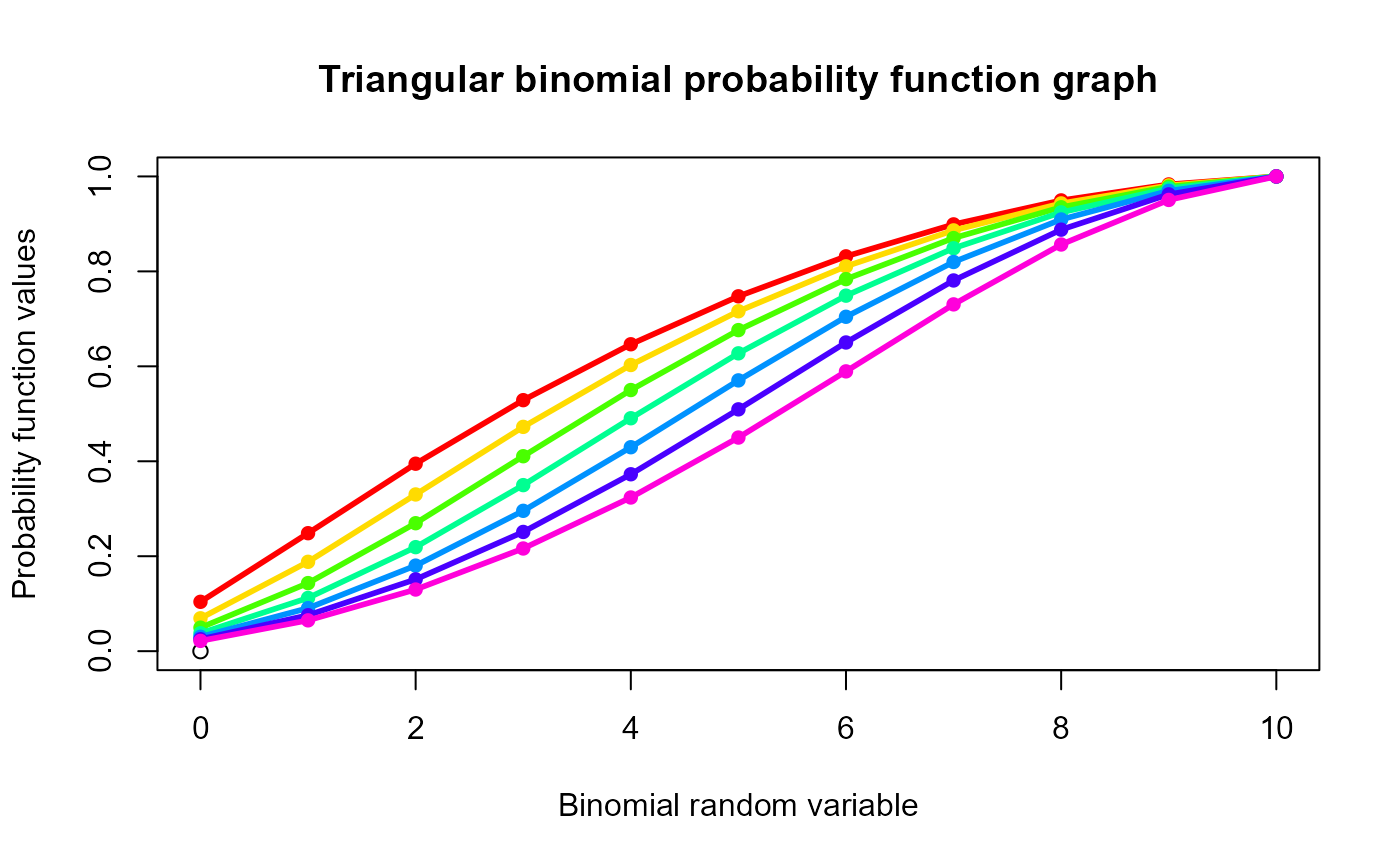
These functions provide the ability for generating probability function values and cumulative probability function values for the Triangular Binomial distribution.
Arguments
- x
vector of binomial random variables
- n
single value for no of binomial trials
- mode
single value for mode
Details
Mixing unit bounded Triangular distribution with Binomial distribution will create Triangular Binomial distribution. The probability function and cumulative probability function can be constructed and are denoted below.
The cumulative probability function is the summation of probability function values.
$$P_{TriBin}(x)= 2 {n \choose x}(c^{-1}B_c(x+2,n-x+1)+(1-c)^{-1}B(x+1,n-x+2)-(1-c)^{-1}B_c(x+1,n-x+2))$$ $$0 < mode=c < 1$$ $$x = 0,1,2,...n$$ $$n = 1,2,3...$$
The mean, variance and over dispersion are denoted as $$E_{TriiBin}[x]= \frac{n(1+c)}{3} $$ $$Var_{TriBin}[x]= \frac{n(n+3)}{18}-\frac{n(n-3)c(1-c)}{18} $$ $$over dispersion= \frac{(1-c+c^2)}{2(2+c-c^2)} $$
Defined as \(B_c(a,b)=\int^c_0 t^{a-1} (1-t)^{b-1} \,dt\) is incomplete beta integrals and \(B(a,b)\) is the beta function.
NOTE : If input parameters are not in given domain conditions necessary error messages will be provided to go further.
References
Horsnell G (1957). “Economical acceptance sampling schemes.” Journal of the Royal Statistical Society. Series A (General), 120(2), 148--201. Karlis D, Xekalaki E (2008). The polygonal distribution. Springer. Okagbue HI, Edeki SO, Opanuga AA, Oguntunde PE, Adeosun ME (2014). “Using the Average of the Extreme Values of a Triangular Distribution for a Transformation, and Its Approximant via the Continuous Uniform Distribution.” British Journal of Mathematics and Computer Science, 4(24), 3497.
Examples
#plotting the random variables and probability values
col <- rainbow(7)
x <- seq(0.1,0.7,by=0.1)
plot(0,0,main="Triangular binomial probability function graph",xlab="Binomial random variable",
ylab="Probability function values",xlim = c(0,10),ylim = c(0,.3))
for (i in 1:7)
{
lines(0:10,dTriBin(0:10,10,x[i])$pdf,col = col[i],lwd=2.85)
points(0:10,dTriBin(0:10,10,x[i])$pdf,col = col[i],pch=16)
}


dTriBin(0:10,10,.4)$pdf        #extracting the pdf values
#>  [1] 0.03774136 0.07438334 0.10699425 0.13064720 0.14086322 0.13674651
#>  [7] 0.12148214 0.09984766 0.07555898 0.05048387 0.02525147
dTriBin(0:10,10,.4)$mean       #extracting the mean
#> [1] 4.666667
dTriBin(0:10,10,.4)$var        #extracting the variance
#> [1] 6.288889
dTriBin(0:10,10,.4)$over.dis.para  #extracting the over dispersion value
#> [1] 0.1696429

#plotting the random variables and cumulative probability values
col <- rainbow(7)
x <- seq(0.1,0.7,by=0.1)
plot(0,0,main="Triangular binomial probability function graph",xlab="Binomial random variable",
ylab="Probability function values",xlim = c(0,10),ylim = c(0,1))
for (i in 1:7)
{
lines(0:10,pTriBin(0:10,10,x[i]),col = col[i],lwd=2.85)
points(0:10,pTriBin(0:10,10,x[i]),col = col[i],pch=16)
}


pTriBin(0:10,10,.4)    #acquiring the cumulative probability values
#>  [1] 0.03774136 0.11212471 0.21911896 0.34976615 0.49062937 0.62737588
#>  [7] 0.74885802 0.84870568 0.92426467 0.97474853 1.00000000
